Recruit analytics
Recruit > Analytics shows how the applications of your company move through the pipeline and what each recruiter does, for a period you choose. It has two tabs: Pipeline and Communication. Every number counts applications, not candidates.
Who this is for
Section titled “Who this is for”- Seeing the page needs View Recruit analytics. With it alone, the recruiters panels show only your own row.
- Seeing every row of the recruiters panels needs View team analytics.
- The Owner and Admin roles have both; Read only sees the page with its own row. See Roles and permissions.
Before you start
Section titled “Before you start”The numbers come from what your team already does in Recruit: applications, stage moves, calls, notes, tasks, messages, interviews and scorecards. A new company sees empty panels until there is activity in the period.
Read the panels
Section titled “Read the panels”- Open Recruit in the menu on the left, then Analytics.
- Choose the Period: Last 7 days, Last 30 days, Last 90 days, or Dates with From and To (at most 366 days). The line under the filters says the dates and the time zone used.
- Optional: narrow by Job, Recruiter (including Unassigned) and Channel.
- Read the Pipeline tab:
- Funnel: the applications created in the period that reached each stage. A skipped stage counts as passed, and a reopened application counts once.
- Time: the Median days to hire and the 90th percentile days to hire, from the creation of the application to the hire, and the Median days in each stage.
- Reasons: the applications created in the period that are not qualified or withdrawn now, by reason.
- Recruiters: for each recruiter, the Active applications, Stage moves, Calls, Notes, Tasks completed, Tasks overdue, Hires and the Median days to first contact.
- Open the Communication tab:
- Speed to first contact: from the application to its first SMS, with the median, the 90th percentile and the share Texted within 60 seconds. An application never texted counts as not answered within 60 seconds.
- Reply rate: the first SMS sent in the period and the share answered within 48 hours, by the source of the lead. The last two days may still grow.
- Templates: for each message template, the messages Sent and Delivered, the Replies within 48 hours, the Reply rate and the Stop requests.
- Interviews: Booked, Completed, No-shows, Canceled, Rescheduled, the Show rate and how many were Booked by the candidate.
- By recruiter: Messages by hand, the Median answer time in working hours (messages that arrived inside the weekly hours of the recruiter, set in Availability), Interviews completed and Scorecards submitted.
- Select Export CSV on a panel to download its numbers.
Open the screenshot at full size in a new tab: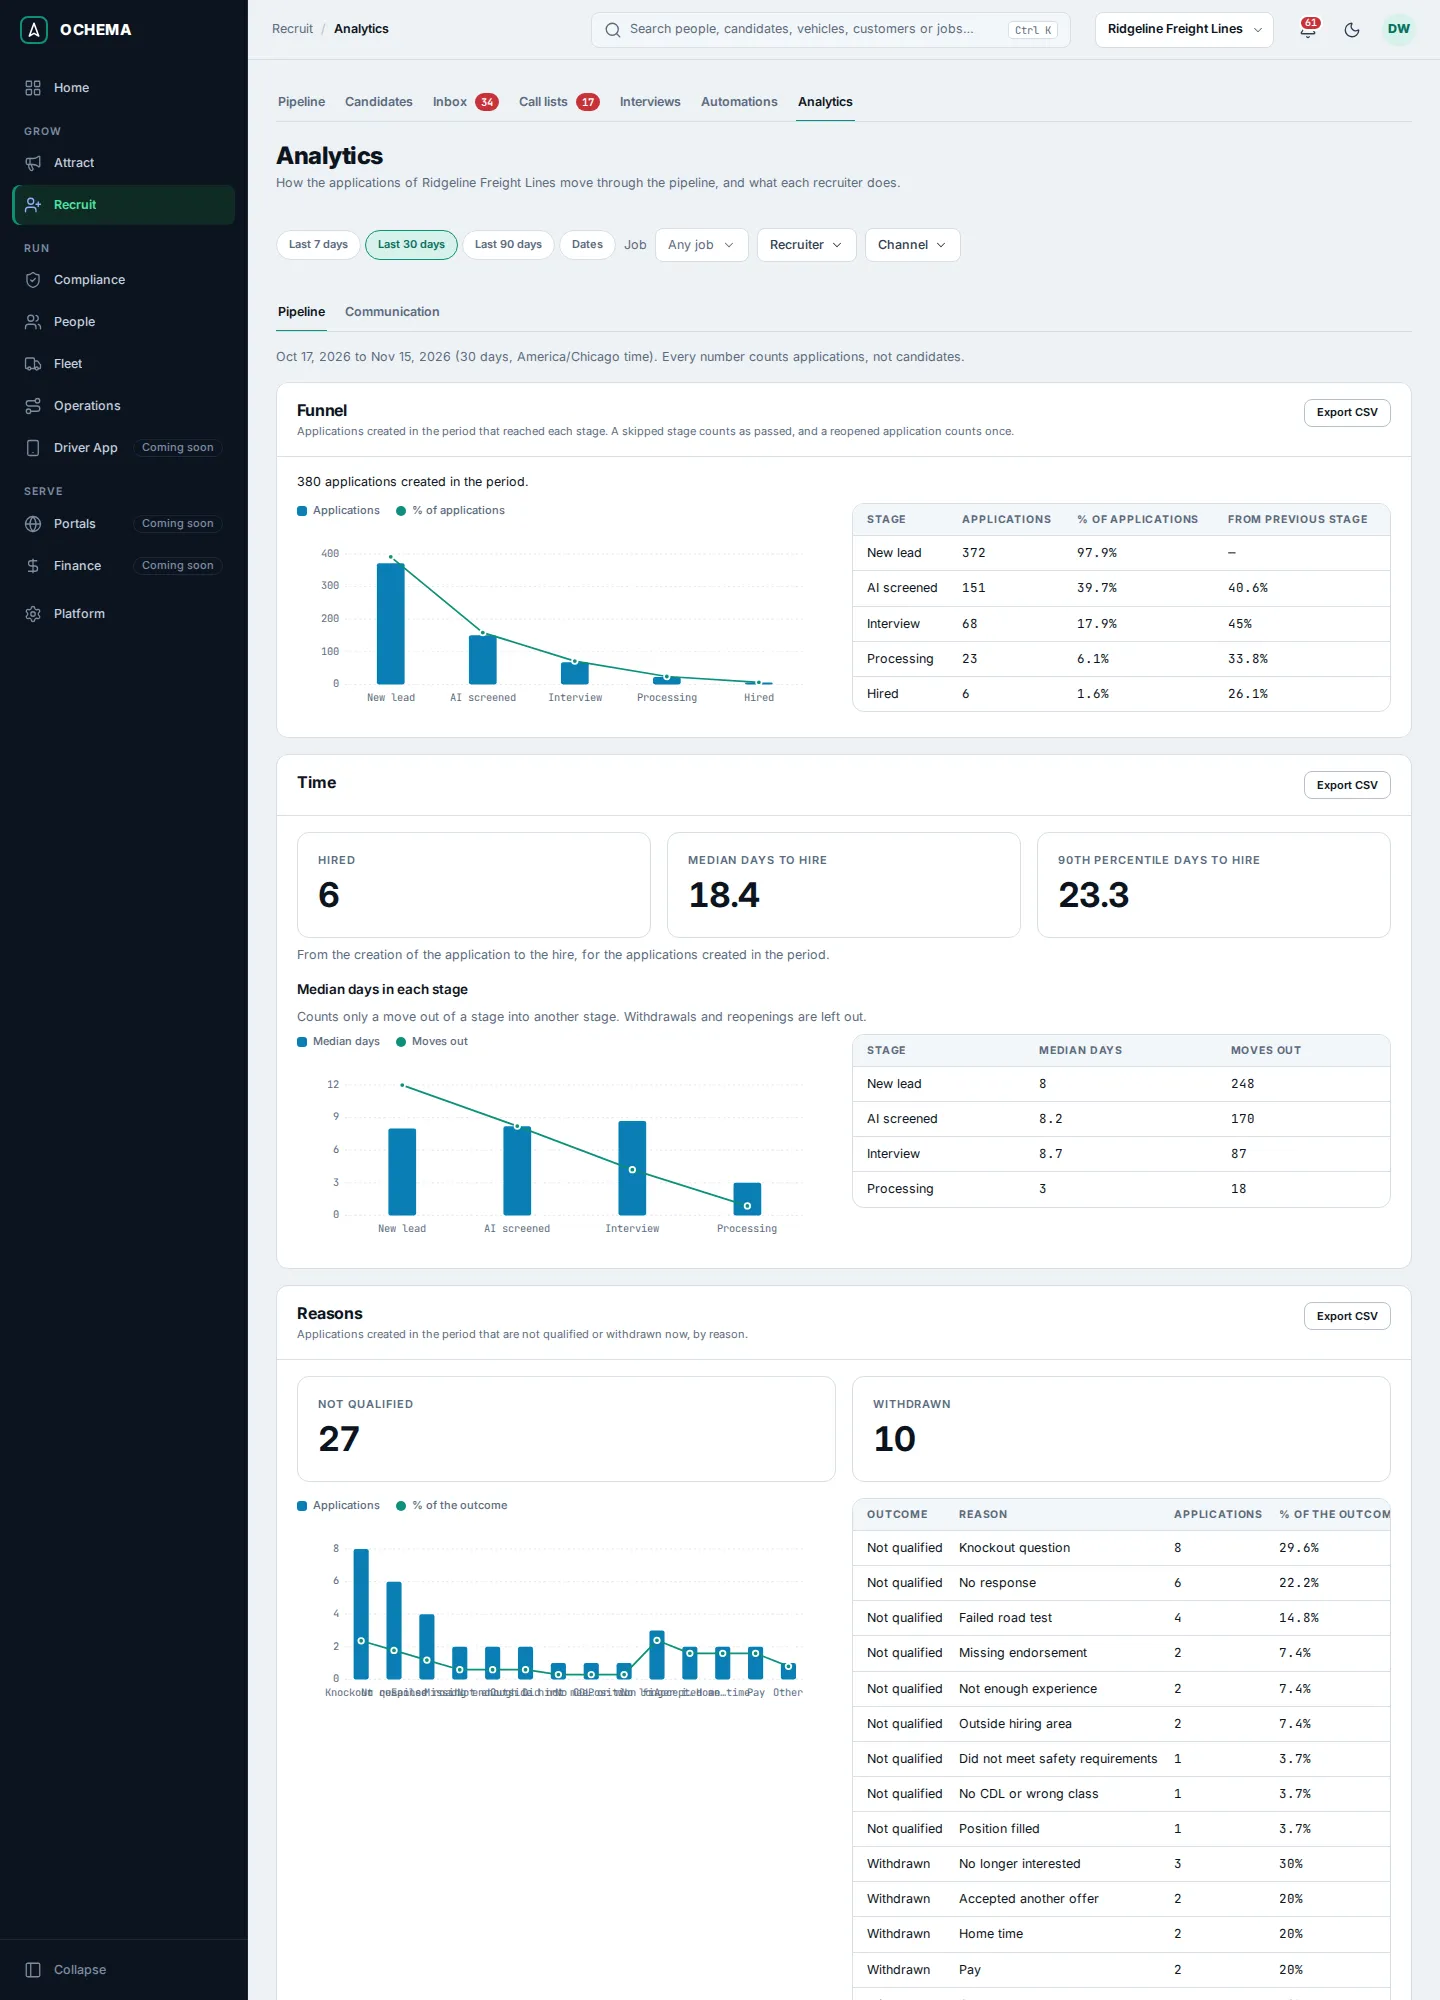
Open the screenshot at full size in a new tab: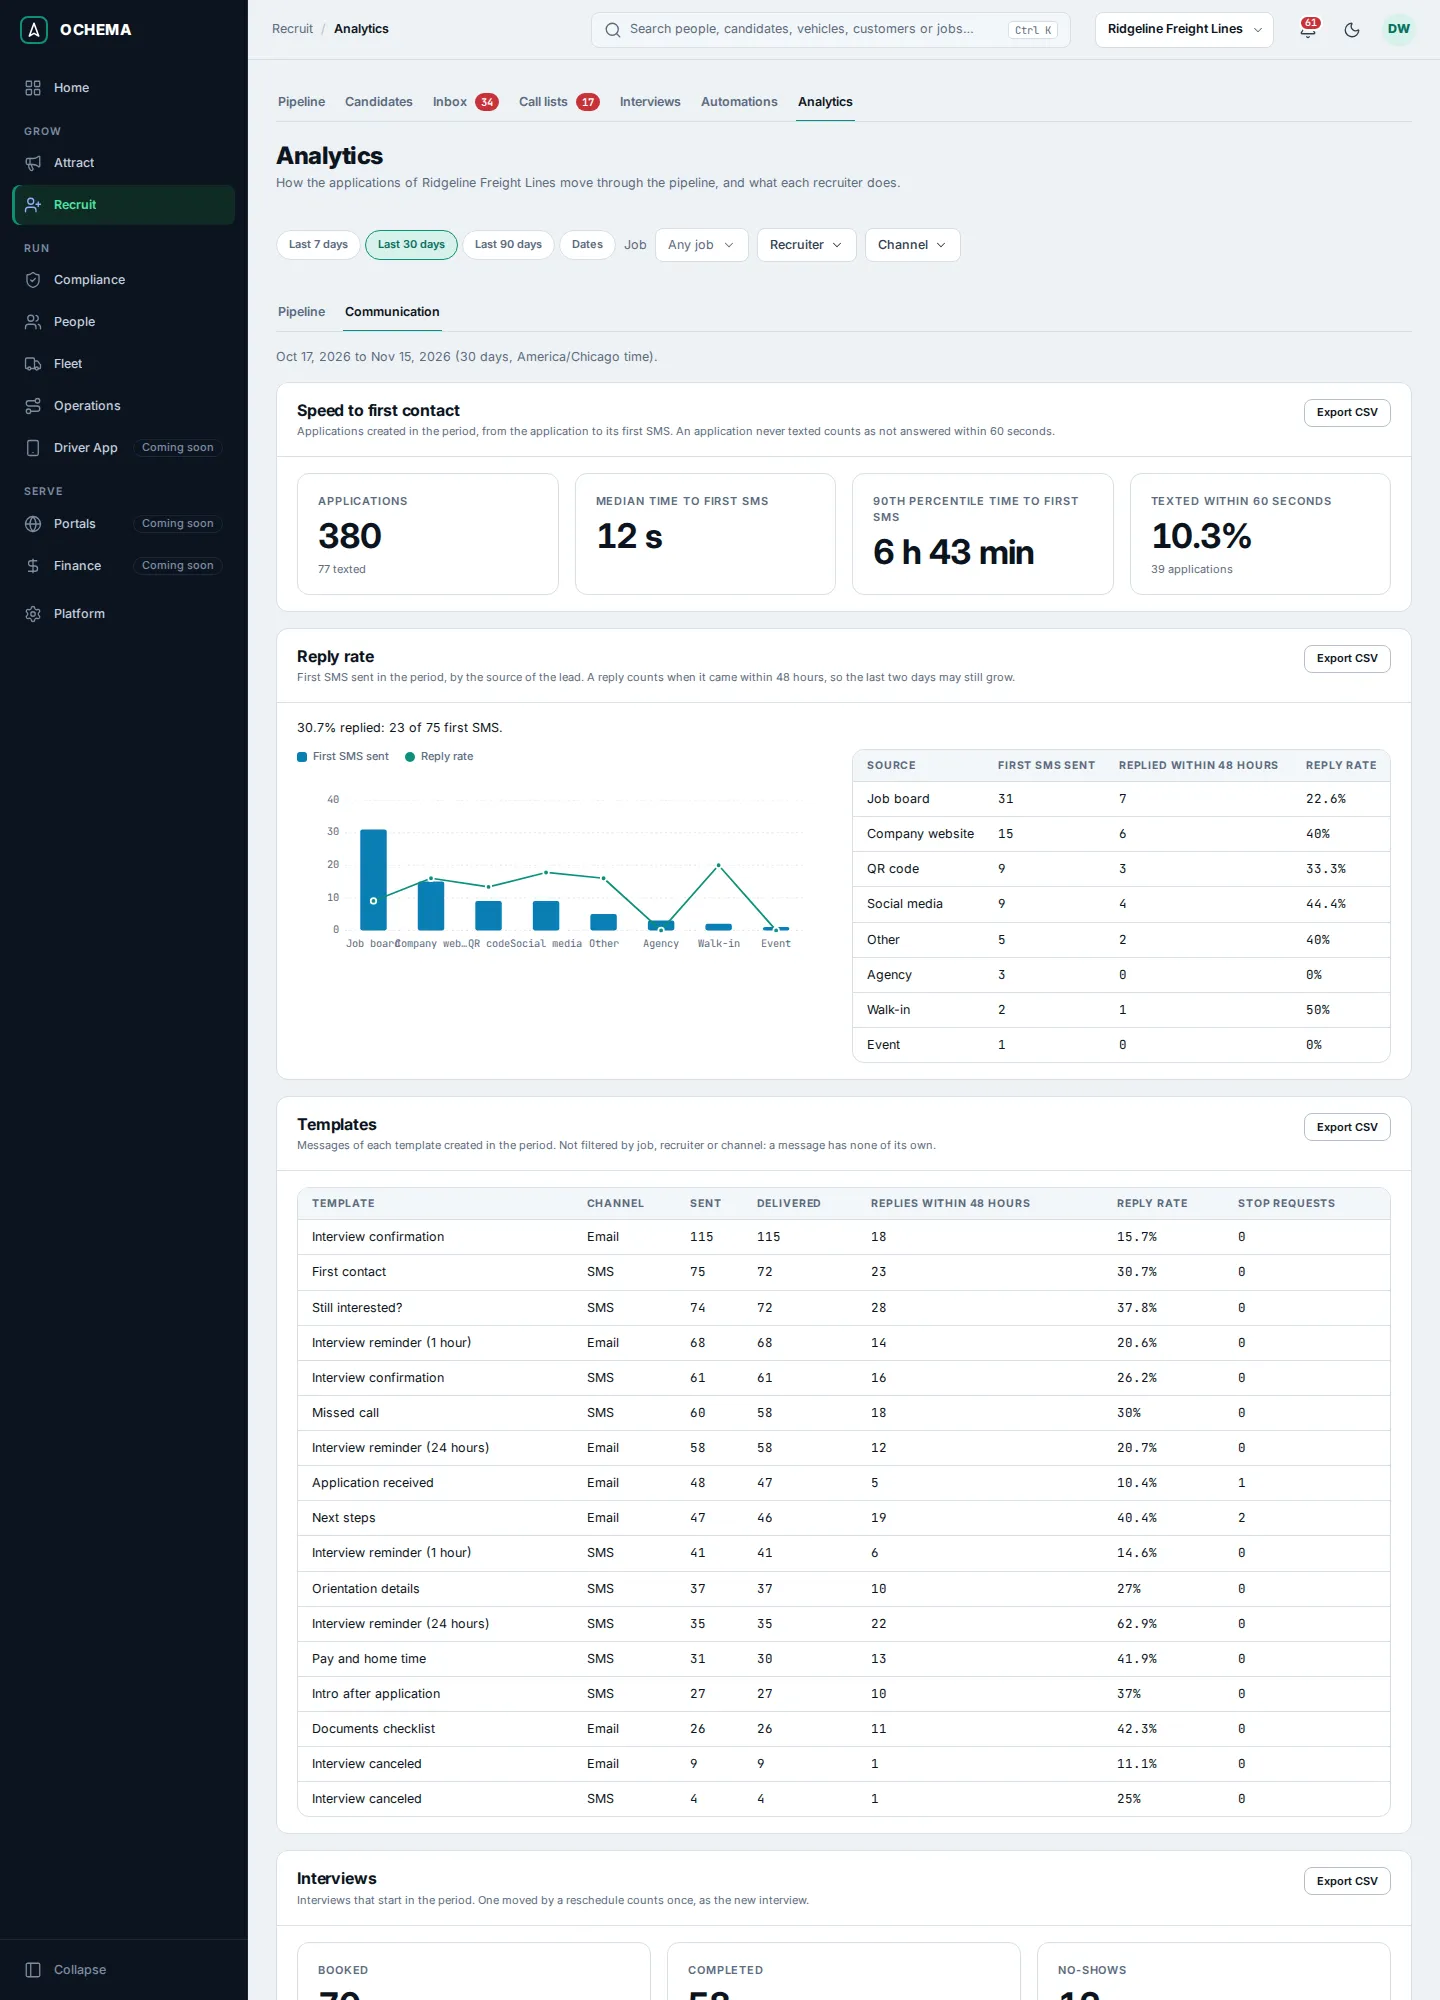
When no application of the period got a first SMS, the Speed to first contact panel says so and points to the first contact rule. See Automations.
What happens next
Section titled “What happens next”Use the panels to find the stage where applications wait the longest, the reasons that close the most applications, and the sources whose leads answer. Lead sources and campaigns have their own numbers in Attract > Analytics; see Tracked links and sources.